Logging and Viewing Training Results
Contents
Logging and Viewing Training Results#
In this section, we describe how to configure the logging and evaluations that occur during your training run, and how to view the results of a training run.
Configuring Logging#
Saving Experiment Logs#
Configured under experiment.logging:
"logging": {
    # save terminal outputs under `logs/log.txt` in experiment folder
    "terminal_output_to_txt": true,

    # save tensorboard logs under `logs/tb` in experiment folder
    "log_tb": true
},
Saving Model Checkpoints#
Configured under experiment.save:
"save": {
    # enable saving model checkpoints
    "enabled": true,

    # controlling frequency of checkpoints
    "every_n_seconds": null,
    "every_n_epochs": 50,
    "epochs": [],

    # saving the best checkpoints
    "on_best_validation": false,
    "on_best_rollout_return": false,
    "on_best_rollout_success_rate": true
},
Evaluating Rollouts and Saving Videos#
Evaluating Rollouts#
Configured under experiment.rollout:
"rollout": {
    "enabled": true,              # enable evaluation rollouts
    "n": 50,                      # number of rollouts per evaluation
    "horizon": 400,               # number of timesteps per rollout
    "rate": 50,                   # frequency of evaluation (in epochs)
    "terminate_on_success": true  # terminating rollouts upon task success
}
Saving Videos#
To save videos of the rollouts, set experiment.render_video to true.
Viewing Training Results#
Contents of Training Outputs#
After the script finishes, you can check the training outputs in the <train.output_dir>/<experiment.name>/<date> experiment directory:
config.json               # config used for this experiment
logs/                     # experiment log files
  log.txt                    # terminal output
  tb/                        # tensorboard logs
videos/                   # videos of robot rollouts during training
models/                   # saved model checkpoints
Loading Trained Checkpoints
Please see the Using Pretrained Models tutorial to see how to load the trained model checkpoints in the models directory.
Viewing Tensorboard Results#
The experiment results can be viewed using tensorboard:
$ tensorboard --logdir <experiment-log-dir> --bind_all
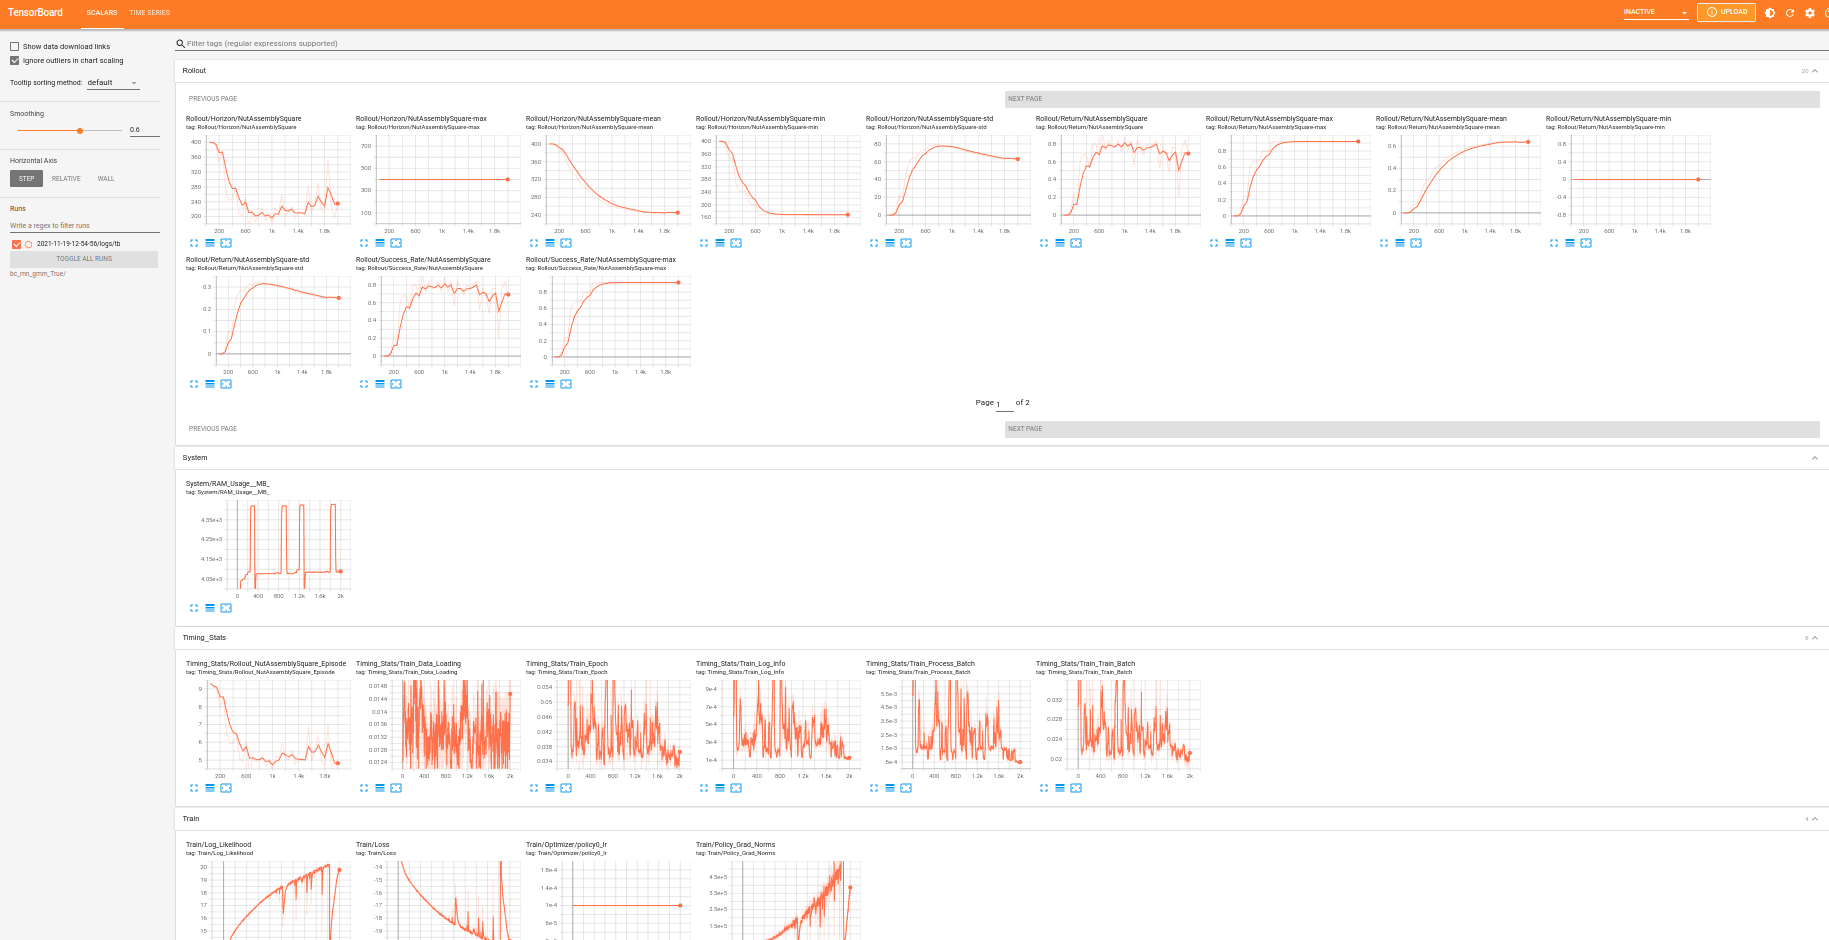
Below is a snapshot of the tensorboard dashboard:

Experiment results (y-axis) are logged across epochs (x-axis). You may find the following logging metrics useful:
Rollout/: evaluation rollout metrics, eg. success rate, rewards, etc.Rollout/Success_Rate/{envname}-max: maximum success rate over time (this is the metric the study paper uses to evaluate baselines)
Timing_Stats/: time spent by the algorithm loading data, training, performing rollouts, etc.Timing_Stats/: time spent by the algorithm loading data, training, performing rollouts, etc.Train/: training statsValidation/: validation statsSystem/RAM Usage (MB): system RAM used by algorithm